Disk and MoBo temp monitor in transparent Conky...

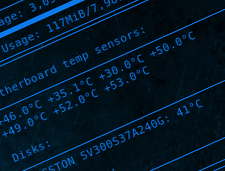
Conky monitoring widget
Conky is a cool monitoring piece of software.
When set with transparency, it provides a kind of cool, floating monitoring widget in your desktop, providing a clear, nice and quick overview of our computer, providing plenty of information from many sources (CPU clock, hardware temp, filesystem usages, processes, etc, etc...)

Being a comunity creation, our beloved Debian has packaged binaries, and installeing it is a piece of cake:
apt-get install conky conky-all
but installing conky isn't the matter, the problem comes with recent changes in Conky's configuration file, that renders plenty of old, cool configs unusable.
Of course, this will change very soon! but this means everyone has to share his experience in the way.
Getting motherboard temps
I wanted to have as much temp info available (mobo, GPU, CPU, and HDDs) as possible.
So I had to perform in my desktop typical thing we do in servers.... let's install lm-sensensors and hddtemp!
apt-get install hddtemp lm-sensors
After doig so, we are ready to configure lm-sensors to know about our hardware. This means basically that we do have to run the sensors-detect command and follow the interactive process of hardware sensors detection and inventorization.
sensors-detect
I suggest you answering YES to all questions, making the script perform full in-depth scan, since I have never had a problem while sensors-detect is inspecting any hardware.
Also, the last step in the assistant ask you about enabling necessary kernel modules to enable monitoring, it is up to you, but, my experience asking always YES has never been caused a single problem.
Now test that your sensors command do work, and you got sensors readings... you should have results in this fashion:
root@laptop:~# sensors

acpitz-virtual-0
Adapter: Virtual device
temp1:        +43.0°C  (crit = +105.0°C)
temp2:        +29.2°C  (crit = +105.0°C)
temp3:        +30.0°C  (crit = +110.0°C)
temp4:        +50.0°C  (crit = +256.0°C)
temp5:        +46.0°C  (crit = +105.0°C)

coretemp-isa-0000
Adapter: ISA adapter
Core 0:       +48.0°C  (high = +100.0°C, crit = +100.0°C)
Core 1:       +48.0°C  (high = +100.0°C, crit = +100.0°C)
Ok...but... too much text isn't it?
Let's get rid of all except the temp readings since we do not have much space in a widget...
alex@laptop:~$ sensors | grep °C | awk '{for(i=1;i<=NF;i++){if ($i ~/°C$/) {print $i}}}' | xargs -s 32
+46.0°C +34.1°C +30.0°C
+50.0°C +49.0°C +51.0°C
+51.0°C
alex@laptop:~$ sensors | grep °C | awk '{for(i=1;i<=NF;i++){if ($i ~/°C$/) {print $i}}}' | xargs -s 64
+46.0°C +34.1°C +30.0°C +50.0°C +49.0°C +52.0°C
+53.0°C
alex@laptop:~$ sensors | grep °C | awk '{for(i=1;i<=NF;i++){if ($i ~/°C$/) {print $i}}}' | xargs -s 48
+46.0°C +34.1°C +30.0°C +50.0°C
+49.0°C +51.0°C +51.0°C
As you see, we can control how much "width" do we get in the command output by using xargs.
In this case I tested with 32, 48, and 64 chars values to test which fits bether to my screen resolution
So, I added in /etc/conky/conky.conf the following lines to create a motherboard temperatures section:
Motherboard temp sensors:
$hr
${exec sensors | grep °C | awk '{for(i=1;i<=NF;i++){if ($i ~/°C$/) {print $i}}}' | xargs -s 32}
Getting disks temperatures
This one is easier than the past one, but a little bit more tricky:
The hddtemp command is installed as /usr/sbin/hhdtemp full path, meaning it is a superuser-only command.
Using it is as simple as doing like this:
hddtemp /dev/sdX
And you get what you look for... pretty straighforward:
root@laptop:# /usr/sbin/hddtemp /dev/sda
/dev/sda: KINGSTON SV300S37A240G: 37°C
Again, for my conky widget I'm only interested on part of the output string... so lets pipe output a little bit:
root@laptop:# /usr/sbin/hddtemp /dev/sda | awk '{print $2, $3, $4}'
KINGSTON SV300S37A240G: 38°C
So, to get your cool desktop computer RAID5 disk array temps nicelly monitored, you could add to conky's config script something like this:
Disks:
$hr
${exec /usr/sbin/hddtemp /dev/sda | awk '{print $2, $3, $4}'}
${exec /usr/sbin/hddtemp /dev/sdb | awk '{print $2, $3, $4}'}
${exec /usr/sbin/hddtemp /dev/sdc | awk '{print $2, $3, $4}'}
...but then, you'll realize it doesn't work.
The problem is that we need to enable 'normal' users to run hddtemp command.
To do so, just execute the following:
chmod +s /usr/sbin/hddtemp
Ensure it works by running hddtemp again as user:
alex@laptop:~$ /usr/sbin/hddtemp /dev/sda
/dev/sda: KINGSTON SV300S37A240G: 37°C
Sharing my conky config
Just in case someone is needing a base running conky config with transparency running as I needed, here I share mine:
- vim: ts=4 sw=4 noet ai cindent syntax=lua
-[[
onky, a system monitor, based on torsmo

ny original torsmo code is licensed under the BSD license

ll code written since the fork of torsmo is licensed under the GPL

lease see COPYING for details

opyright (c) 2004, Hannu Saransaari and Lauri Hakkarainen
opyright (c) 2005-2012 Brenden Matthews, Philip Kovacs, et. al. (see AUTHORS)
ll rights reserved.

his program is free software: you can redistribute it and/or modify
t under the terms of the GNU General Public License as published by
he Free Software Foundation, either version 3 of the License, or
at your option) any later version.

his program is distributed in the hope that it will be useful,
ut WITHOUT ANY WARRANTY; without even the implied warranty of
ERCHANTABILITY or FITNESS FOR A PARTICULAR PURPOSE.  See the
NU General Public License for more details.
ou should have received a copy of the GNU General Public License
long with this program.  If not, see <http://www.gnu.org/licenses/>.
]

onky.config = {
   alignment = 'top_right',
   background = true,
   border_width = 1,
   cpu_avg_samples = 2,
   default_color = '0b79ec',
   default_outline_color = '0b79ec',
   default_shade_color = '0b79ec',
   draw_borders = false,
   draw_graph_borders = true,
   draw_outline = false,
   draw_shades = false,
   use_xft = true,
   font = 'DejaVu Sans Mono:size=8',
   gap_x = 5,
   gap_y = 40,
   minimum_height = 5,
   minimum_width = 5,
   net_avg_samples = 2,
   no_buffers = true,
   out_to_console = false,
   out_to_stderr = false,
   extra_newline = false,
   own_window = true,
   own_window_class = 'Conky',
   own_window_type = 'desktop',
   stippled_borders = 0,
   update_interval = 1.0,
   uppercase = false,
   use_spacer = 'none',
   show_graph_scale = false,
   show_graph_range = false,
   double_buffer = true,
   own_window = true,
   own_window_transparent = true,
   own_window_type = 'normal',
   own_window_hints = 'undecorated,below,sticky,skip_taskbar,skip_pager'


onky.text = [[
{scroll 32 $nodename - $sysname $kernel on $machine | }
hr
{color #0b79ec}Uptime:$color $uptime

{color #0b79ec}Processors:
hr
{color #0b79ec}Frequency (in GHz):$color $freq_g
{color #0b79ec}CPU Usage:$color ${cpu cpu1}% ${cpubar cpu1 4}
{color #0b79ec}CPU Usage:$color ${cpu cpu2}% ${cpubar cpu2 4}
{color #0b79ec}CPU Usage:$color ${cpu cpu3}% ${cpubar cpu3 4}
{color #0b79ec}CPU Usage:$color ${cpu cpu4}% ${cpubar cpu4 4}
{color #0b79ec}Temperature: $color ${exec sensors | grep 'Core 0' | cut -c16-24}

{color #0b79ec}Memory:
hr
{color #0b79ec}RAM Usage:$color $mem/$memmax - $memperc%
{membar 4}
{color #0b79ec}Swap Usage:$color $swap/$swapmax - $swapperc%
{swapbar 4}

{color #0b79ec}GPU:
hr
{color #0b79ec}GPU Model: Nvidia GT730
{color #0b79ec}GPU GPUFreq:$color ${execi 60 nvidia-settings -q GPUCurrentClockFreqs | grep gpu:0 |     rep -o '[0-9,]\{2,10\}'} MHz
{color #0b79ec}GPU Memory:$color ${execi 60 nvidia-settings -q UsedDedicatedGPUMemory | grep gpu:0 |     rep -o '[0-9]\{2,3\}'} MB
{color #0b79ec}GPU Temp:$color ${execi 60 nvidia-settings -q GPUCoreTemp | grep gpu:0 | grep -o '[    -9]\{2,3\}'} °C

{color #0b79ec}Motherboard temp sensors:
hr
{color #0b79ec}${exec sensors | grep °C | awk '{for(i=1;i<=NF;i++){if ($i ~/°C$/) {print $i}}}' |     args -s 48}

{color #0b79ec}Disks:
hr
{color #0b79ec}${exec /usr/sbin/hddtemp /dev/sda | awk '{print $2, $3, $4}'}
{color #0b79ec}${exec /usr/sbin/hddtemp /dev/sdb | awk '{print $2, $3, $4}'}
{color #0b79ec}${exec /usr/sbin/hddtemp /dev/sdc | awk '{print $2, $3, $4}'}
{color #0b79ec}${exec /usr/sbin/hddtemp /dev/sdd | awk '{print $2, $3, $4}'}

{color #0b79ec}File systems:
hr
 $color${fs_used /}/${fs_size /}
{fs_bar 6 /}
boot $color${fs_used /boot}/${fs_size /boot}
{fs_bar 6 /boot}
home $color${fs_used /home}/${fs_size /home}
{fs_bar 6 /home}

{color #0b79ec}Networking:
hr
np4s0 Up:$color ${upspeed enp4s0} ${color #0b79ec} $alignr enp4s0 Down:$color ${downspeed enp4s0}
{upspeedgraph enp4s0 15,105 0b79ec 0b79ec} $alignr ${downspeedgraph enp4s0 15,105 0b79ec 0b79ec}
np4s0 address:$color ${addr enp4s0}

iLink Up:$color ${upspeed enx582c80139263} ${color #0b79ec} $alignr HiLink Down:$color ${downspeed     nx582c80139263}
{upspeedgraph enx582c80139263 15,105 0b79ec 0b79ec} $alignr ${downspeedgraph enx582c80139263 15,105     b79ec 0b79ec}
iLink address:$color ${addr enx582c80139263}

lp5s0 Up:$color ${upspeed wlp5s0} ${color #0b79ec} $alignr wlp5s0 Down:$color ${downspeed wlp5s0}
{upspeedgraph wlp5s0 15,105 0b79ec 0b79ec} $alignr ${downspeedgraph wlp5s0 15,105 0b79ec 0b79ec}
np5s0 address:$color ${addr enp5s0}

{color #0b79ec}Processes:
hr
{color #0b79ec}Processes:$color $processes  ${color #0b79ec}Running:$color $running_processes

{color #0b79ec}Name              PID   CPU%   MEM%
{color #0b79ec} ${top name 1} ${top pid 1} ${top cpu 1} ${top mem 1}
{color #0b79ec} ${top name 2} ${top pid 2} ${top cpu 2} ${top mem 2}
{color #0b79ec} ${top name 3} ${top pid 3} ${top cpu 3} ${top mem 3}
{color #0b79ec} ${top name 4} ${top pid 4} ${top cpu 4} ${top mem 4}
]
Enjoy monitoring!