Monitoring CISCO ACLs with ELK stack 5.4 (part2)

Hi again people!
In this second article (visit here part1) about ELK setup on Linux Debian to analyze CISCO logs (ACLs and/or PIX/ASA) I will keep giving shape to the notes I took during the actual setup.
It is very useful to me to learn and consolidate knoledge, ordering my notes creating a meaningful article... Hope that work maybe is usefull to someone else...
So, this time I'going to deal with the installation and setup of Elasticsearh.
You may find some interesting links in the previous article about Elasticsearc itself.
As explained in the previous article, this install will be very minimal (an all-in-one ELK server lab) install, so no clustering here.
Also, note that, in this second article, both the Elasticsearch Debian repository and Java 8 JRE are already setup and working.
Installing with apt-get
Installing ELK software components is pretty straightforward, in this case:
apt-get install elasticsearch
To manage elasticsearch there is provided a systemd service config file, but I needed to tweak the memory limits to avoid memory problems on the JVM.
mkdir /etc/systemd/system/elasticsearch.service.d
pico /etc/systemd/system/elasticsearch.service.d/elasticsearch.conf
An then paste the following into that /etc/systemd/system/elasticsearch.service.d/elasticsearch.conf file:
[Service]
LimitMEMLOCK=infinity
Also, we need to tweak system-wide limits for the elasticsearch user under which the service will run.
edit /etc/security/limits.conf and add the following lines at the end:
elasticsearch soft memlock unlimited
elasticsearch hard memlock unlimited
you may also run as root:
ulimit -l unlimited
Configure Java VM environment:
Again, we need to tweak the memory allocation available to the Java Virtual Machine when spawning the elasticsearch process.
So, edit the file /etc/elasticsearch/jvm.options and, put adecuate values to the following two parameters (in this example, thy're seat at 2 GB, as they're set as default):
-Xms2g
-Xmx2g
For production environment of dedicated hosts, half of the RAM should be dedicated to the task...
If you have 8GB of RAM and want to dedicate 4GB to elasticsearch replace those lines by something like this:
-Xms4g
-Xmx4g
Configure Elasticsearch:
Elasticsearch comes with a mostly working default configuration.
This configuration is far from be a true production config, since, in fact, in a production environment elasticsearch would be run by a cluster of servers, having different roles each, and the configuration would be very role-dependant and cluster-detail dependant.
But, even a single server, we shoud look in the config file /etc/elasticsearch/elasticsearch.yml for three lines, and setup them accordingly to our case:
cluster.name: YOURCLUSTER
bootstrap.memory_lock: true
network.host: 192.168.X.Y
Basically, a name for your cluster (even a single server joins a cluster), an IP address other than localhost if you want to query elasticsearch from outside the server itself, and enable memory locking feature (this is strongly recommended for good performance and stability).
Once this is done, you can proceed to enable the service to be started on boot and manually starting it:
systemctl daemon-reload
systemctl enable elasticsearch.service
systemctl start elasticsearch.service
You may check the service is running normally, which should yeld something like this on te console:
root@server:~# service elasticsearch status
● elasticsearch.service - Elasticsearch
   Loaded: loaded (/usr/lib/systemd/system/elasticsearch.service; disabled)
  Drop-In: /etc/systemd/system/elasticsearch.service.d
           └─elasticsearch.conf
   Active: active (running) since Sat 2017-06-03 19:09:09 CEST; 5min ago
     Docs: http://www.elastic.co
  Process: 16428 ExecStartPre=/usr/share/elasticsearch/bin/elasticsearch-systemd-pre-exec (code=exited, status=0/SUCCESS)
 Main PID: 16431 (java)
Also, you can query your empty elasticsearch database, although empty, and still have a nice reply indicating it is currently up and running.
In the example bellow I use the curl command to bind to the local elasticsearch instance without issuing any query (no parameters), which results in a kind of '--version' equivalent for an elasticsearch query:
root@server:~# curl http://192.168.X.Y:9200
{
  "name" : "server01",
  "cluster_name" : "YOURCLUSTER",
  "cluster_uuid" : "efjeh###fnmjjsnfboPw",
  "version" : {
    "number" : "5.4.1",
    "build_hash" : "2cfe0df",
    "build_date" : "2017-05-29T16:05:51.443Z",
    "build_snapshot" : false,
    "lucene_version" : "6.5.1"
  },
  "tagline" : "You Know, for Search"
}
(Optional) Installing the head plugin
The head plugin was a plugin for elasticsearch that provided a very useful web GUI manager / browser for elasticsearch cluster.
From elasticsearch 5.X onwards http plugins are not possible, so, Head plugin has to be run separately, as a nodeJS standalone server and application.
Basically, It creates a mini web server listening on 9100 that provides the former GUI from the head plugin and an underlaying client that does the actual binding to the elasticsearch cluster through regular binding.
You can install the required nodeJS environment by installing the npm package, so just with:
apt-get install node npm
Should last to have a minimal environment...
...But chances are that the Debian maintainer's provided npm environment is too old to run head (or anything modern), specially in Jessie.
So it is higly recommended to use latest npm through oficial Debia repository.
In a former article about running another nodeJS application in Debian (the ghost-blog platform) I solved this problem of old npm, and there are all the necessary steps to setup modern nodeJS environment very easily.
Once you've a decent npm up and running, we need to edit elasticsearch configuration in our single-server cluster (in a production environment this configuration change may not be needed at dedicated master servers or data servers if they're not intended to handle queries from external clients, it would depend on the infrastructure...).
So here we edit /etc/elasticsearch/elasticsearch.yml and append at the end the following lines:
http.cors.enabled : true
http.cors.allow-origin : "*"
http.cors.allow-methods : OPTIONS, HEAD, GET, POST, PUT, DELETE
http.cors.allow-headers : X-Requested-With,X-Auth-Token,Content-Type, Content-Length
And restart Elasticsearch to apply those changes:
service elasticsearch restart
Now we will do de actual installation of the head nodeJS project, cloning it from its public github repository.
So ensure you have git utility installed, and choose a place to put the project.
I used the /opt folder to put it on, and the process lokked like this:
cd /opt
git clone git://github.com/mobz/elasticsearch-head.git
cd elasticsearch-head
npm install
At this point, you could run the project by executing the command:
npm run start
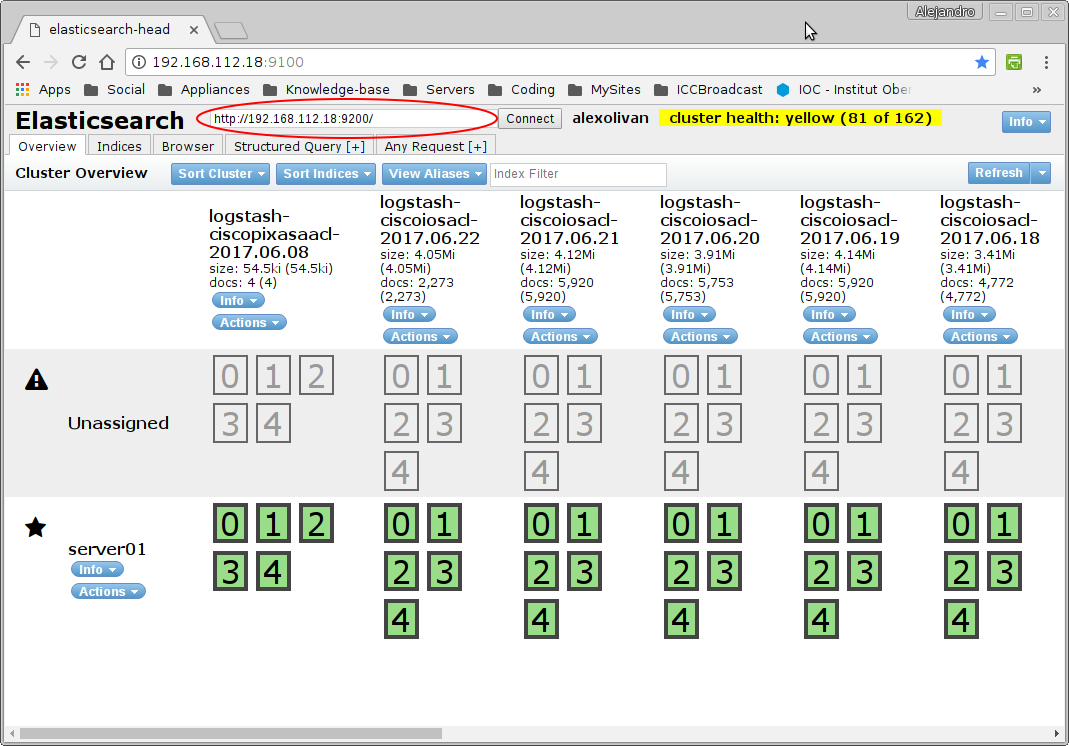
And then, with your favourite web browser, point to your server elasticsearch-head URL at port 9100 (http://192.168.X.Y:9100).
You'll have to point the aplication to connect with your server, so enter the http URL that reaches your elasticsearch instance (http://192.168.X.Y:9200) and click connect
Visit the Elasticsearch-head plugin project page to get more information on how it works (although I find it very intuitive).
I think but, that having to cd into project folder and run it on the cli while doing some management isn't very much convenient, since, obviously, as soon as you Ctrl+C the npm run start command Elasticsearh-head vanishes.
So Let's create a systemctl service to allow management of elasticsearc-head aplication just as any other system service:
Create the service file /etc/systemd/system/elasticsearch-head.service and paste the following contents:
[Unit]
Description=Front end for an elasticsearch cluster

[Service]
WorkingDirectory=/opt/elasticsearch-head
ExecStart=/usr/bin/npm start
Restart=always
StandardOutput=syslog
StandardError=syslog
SyslogIdentifier=notell
User=root
Group=root
Environment=NODE_ENV=production

[Install]
WantedBy=multi-user.target
And now a few commands to finish the job:
chmod 755 /etc/systemd/system/elasticsearch-head.service
systemctl daemon-reload
systemctl enable elasticsearch-head.service
systemctl start elasticsearch-head.service
Finally... check it works!
root@server:~# netstat -tunlp | grep 9100
tcp        0      0 0.0.0.0:9100            0.0.0.0:*               LISTEN
27339/grunt

root@server:~# service elasticsearch-head status
● elasticsearch-head.service - Front end for an elasticsearch cluster
   Loaded: loaded (/etc/systemd/system/elasticsearch-head.service; enabled)
   Active: active (running) since Sat 2017-06-03 20:30:14 CEST; 2min 58s ago
 Main PID: 27326 (npm)
   CGroup: /system.slice/elasticsearch-head.service
           ├─27326 npm
           ├─27338 sh -c grunt server
           └─27339 grunt
(Optional) Installing Elasticsearc-curator
The elasticsearch-curator is a command-line utility that eases the automation and scripting of maintenance tasks on the Elasticsearch cluster.
A very typicall usage of the curator command is to use it to control how long information has to be kept in the database, since, by its nature, the amount of information produced by service logs tends to grow infinitelly over time.
Note that curator can do more than just deleting old indices, so visit the project site to get more info about it.
This tool was, as I started playing with ELK stack, a separate python tool that used to be installed through python pip manager, but it can be now installed using its own Debain package repository.
So, to add the repo to your sources I sugggest creating a new file sucha as /etc/apt/sources.list.d/curator-5.x.list with the following line:
deb [arch=amd64] http://packages.elastic.co/curator/5/debian stable main
And then prcoceed with installation:
apt-get update
apt-get install elasticsearch-curator
Now we need to create a configuration file for curator defaults.
I have put it into a new folder at /etc/elasticsearch/curator where I will also put script-tasks... but is is up to you to use another:
mkdir /etc/elasticsearch/curator
Now I create the YML format confuguration contents and put them to the file /etc/elasticsearch/curator/config.yml (adjust values to your needs):
client:
  hosts:
    - 192.168.X.Y
  port: 9200
  url_prefix:
  use_ssl: False
  certificate:
  client_cert:
  client_key:
  ssl_no_validate: False
  http_auth:
  timeout: 30
  master_only: False

logging:
  loglevel: INFO
  logfile:
  logformat: default
  blacklist: ['elasticsearch', 'urllib3']
And now I create a task file that will delete contents older than two weeks. The file I created is /etc/elasticsearch/curator/delete-old-indices.yml and it is based on the documentation example.
There is an oficial extensive curator reeference... so check it out!
actions:
  1:
    action: delete_indices
    description: >-
      Delete indices older than 45 days (based on index name), for logstash-
      prefixed indices. Ignore the error if the filter does not result in an
      actionable list of indices (ignore_empty_list) and exit cleanly.
    options:
      ignore_empty_list: True
      disable_action: False
    filters:
    - filtertype: pattern
      kind: prefix
      value: logstash-
    - filtertype: age
      source: name
      direction: older
      timestring: '%Y.%m.%d'
      unit: days
      unit_count: 14
Now, to execute this maintenance task we may execute the following on the CLI:
curator --config /etc/elasticsearch/curator/config.yml --dry-run /etc/elasticsearch/curator/delete-old-indices.yml
So, you may, for instance, add this to the crontab...
OK, now we're done with elasticsearch part, hope it was usefull to you... see you in the next one!!!